Tri-Share Child Care Program

Empower Working Families. Strengthen Local Economies.

Tri-Share is a shared-cost model where the price of licensed child care is split three ways among the employee (parent), the employer, and a public or community partner, making care more affordable and easier to access.

Tailored Solutions for Your State

Tri-Share programs can be implemented statewide, regionally, or through targeted pilot projects. Our team partners with states to design the necessary frameworks, policy language, and funding models — customizing each approach to ensure the program fits the specific needs, priorities, and workforce landscape of your state. Schedule an introductory call with our Government Solutions team today.

Contact us

Why Governments Choose Tri-Share

Solutions For Governments / Workforce Development

Tri-Share directly addresses two critical challenges: workforce participation and child care affordability. By engaging both employers and families, state leaders can expand access to quality care without creating new administrative burdens.

Tri-Share programs can be implemented statewide, regionally, or through targeted pilot projects. Our team helps states build frameworks, policy language, and funding models.

Download Implementation Guide

Get Started

TESTIMONIALS

Thank you for your support

Ashley Alford Glance, President
Putnam County Chamber of Commerce

Tri-Share is fulfilling its purpose exactly as intended, connecting employers, employees, and the state to create a stronger, more dependable workforce. We encourage state leaders to continue investing in and expanding this program so that even more West Virginians can benefit from its impact.

Ashley King
HR and Volunteer Services Director, HospiceCare

Since joining the Tri-Share program, we've seen a real and positive difference within our team. Employee retention, attendance, and morale have all improved in meaningful ways. Parents who once struggled to afford childcare now have the financial resources, thanks to the shared partnership between employers, employees, and the state.  For our organization, the program has been a wonderful support. It's helped us keep great employees, reduce absences, and strengthen our culture as a family-friendly workplace that truly cares about the people who make our mission possible.

Stephen G. Roberts, President,
West Virginia Chamber of Commerce

The West Virginia Chamber of Commerce is the leading voice of business in our state, representing employers in all 55 counties who collectively provide jobs to more than half of West Virginia’s workforce. Our members in the eight pilot counties consistently report that Tri-Share has improved employee recruitment and retention, reduced absenteeism, and strengthened workplace morale. It’s a model that is proving to work - aligning business, family and state interests in a way that helps keep West Virginians in the workforce.

Will Miller, Director
West Virginia Small Business Development Center, a division of the West Virginia Division of Economic Development

“There are lots of programs that say they're going to help you with things and they're going to help you move the needle and stuff. But Wonderschool has actually come here and spent the time, spent the effort to understand...They are truly with us working day in and day out to make sure Tri-Share is successful and to understand West Virginia and what really makes what makes us tick, what makes us West Virginians. So I can't say enough about the efforts that Wonderschool is putting in to help understand what to do.”

Amy Downey, CFO
Roane General Hospital

We’ve approved our first two employee families and have many more in the pipeline. The Wonderschool platform is simple, user-friendly, and flexible—employees can choose any provider, not just one specific center. The savings can mean hundreds, even thousands, of dollars back in our employees’ pockets.

Jamie Gaeger, Director
Fort Hill Child Development Center, Inc.

As a child care provider, we have witnessed the positive effect the program has had on the families we serve. Parents who previously struggled to afford reliable childcare now have access to high-quality care at a manageable cost. This is possible through the shared contribution model, which distributes the cost among employers, employees, and the state, making childcare more accessible for working families. For our company, participation in the Tri-Share program has been transformative. It has enhanced our ability to attract and retain skilled workers, reduced absenteeism, and strengthened our reputation as a family-friendly employer dedicated to supporting our workforce. We have seen firsthand that the results of this program are genuine and significant.

Tri-Share ROI Calculator

Input your state's initial investment in Tri-Share to calculate the return on that investment, which is a combination of increased tax revenue and avoided costs.

Choose A State
Enter initial investment
Oops! Something went wrong while submitting the form.

Benefits At-A-Glance

Investing in Tri-Share can have a profound impact on your state:
  • Increases workforce participation by removing a major barrier to employment for parents.
  • Protects state GDP and tax revenue, avoiding losses tied to absenteeism, turnover, and reduced productivity.
  • Strengthens business stability, helping employers retain workers and reduce costly turnover.
  • Improves household financial stability, keeping families in the labor force and reducing reliance on safety-net programs.
  • Stabilizes the child care sector, supporting provider growth and capacity expansion.
  • Delivers high return on investment, with state dollars generating outsized economic gains.
  • Supports long-term economic resilience and positions states for stronger growth.
Wyoming
Economic Impact/$
6.3605
Personal tax ratio
28.24
Avoided ratio
70.02
Final figure
1.74
Wisconsin
Economic Impact/$
3.8137
Personal tax ratio
31.28
Avoided ratio
65.32
Final figure
3.4
West Virginia
Economic Impact/$
5.5352
Personal tax ratio
28.22
Avoided ratio
68.96
Final figure
2.82
Virginia
Economic Impact/$
3.959
Personal tax ratio
35.21
Avoided ratio
62.26
Final figure
2.53
Washington
Economic Impact/$
4.1725
Personal tax ratio
28.16
Avoided ratio
70.38
Final figure
1.46
Utah
Economic Impact/$
5.7648
Personal tax ratio
27.48
Avoided ratio
70.89
Final figure
1.63
Vermont
Economic Impact/$
3.7989
Personal tax ratio
32.8
Avoided ratio
65.23
Final figure
1.98
Texas
Economic Impact/$
4.8942
Personal tax ratio
30.44
Avoided ratio
67.42
Final figure
2.14
Tennessee
Economic Impact/$
3.9695
Personal tax ratio
31.1
Avoided ratio
65.4
Final figure
3.5
South Dakota
Economic Impact/$
7.1664
Personal tax ratio
25.37
Avoided ratio
72.71
Final figure
1.92
South Carolina
Economic Impact/$
4.1053
Personal tax ratio
35.56
Avoided ratio
61.55
Final figure
2.89
Rhode Island
Economic Impact/$
4.4427
Personal tax ratio
28.4
Avoided ratio
69.27
Final figure
2.33
Pennsylvania
Economic Impact/$
4.2234
Personal tax ratio
31.64
Avoided ratio
65.25
Final figure
3.12
Oregon
Economic Impact/$
3.7943
Personal tax ratio
32
Avoided ratio
65.5
Final figure
2.5
Oklahoma
Economic Impact/$
4.1684
Personal tax ratio
32.8
Avoided ratio
65.06
Final figure
2.14
North Dakota
Economic Impact/$
6.6887
Personal tax ratio
34.95
Avoided ratio
64.59
Final figure
0.45
Ohio
Economic Impact/$
4.1914
Personal tax ratio
29.69
Avoided ratio
68.32
Final figure
1.99
North Carolina
Economic Impact/$
3.8745
Personal tax ratio
36.88
Avoided ratio
61.85
Final figure
1.28
New York
Economic Impact/$
4.894
Personal tax ratio
42.59
Avoided ratio
55.62
Final figure
1.79
New Mexico
Economic Impact/$
5.2674
Personal tax ratio
34.19
Avoided ratio
63.67
Final figure
2.13
New Jersey
Economic Impact/$
4.3453
Personal tax ratio
33.56
Avoided ratio
64.53
Final figure
1.91
New Hampshire
Economic Impact/$
4.3322
Personal tax ratio
24.3
Avoided ratio
73.19
Final figure
2.51
Nevada
Economic Impact/$
4.0806
Personal tax ratio
32.34
Avoided ratio
65.64
Final figure
2.01
Missouri
Economic Impact/$
3.8025
Personal tax ratio
31
Avoided ratio
65.8
Final figure
3.19
Nebraska
Economic Impact/$
4.8377
Personal tax ratio
31.51
Avoided ratio
66.49
Final figure
2
Montana
Economic Impact/$
4.8936
Personal tax ratio
29.13
Avoided ratio
68.11
Final figure
2.76
Mississippi
Economic Impact/$
5.5538
Personal tax ratio
33.67
Avoided ratio
64.01
Final figure
2.32
Minnesota
Economic Impact/$
4.4804
Personal tax ratio
26.69
Avoided ratio
70.65
Final figure
2.66
Michigan
Economic Impact/$
4.4447
Personal tax ratio
31.63
Avoided ratio
65.42
Final figure
2.95
Massachusetts
Economic Impact/$
3.8836
Personal tax ratio
31.03
Avoided ratio
66.79
Final figure
2.18
Maryland
Economic Impact/$
4.5667
Personal tax ratio
30.56
Avoided ratio
66.87
Final figure
2.57
Maine
Economic Impact/$
5.4608
Personal tax ratio
33.19
Avoided ratio
65.49
Final figure
1.32
Louisiana
Economic Impact/$
5.348
Personal tax ratio
31.81
Avoided ratio
65.58
Final figure
2.61
Kentucky
Economic Impact/$
6.2797
Personal tax ratio
26.9
Avoided ratio
70.99
Final figure
2.11
Iowa
Economic Impact/$
5.9133
Personal tax ratio
30.37
Avoided ratio
67.48
Final figure
2.15
Indiana
Economic Impact/$
4.1837
Personal tax ratio
31.83
Avoided ratio
65.95
Final figure
2.22
Kansas
Economic Impact/$
4.5695
Personal tax ratio
36.9
Avoided ratio
61.43
Final figure
1.67
Illinois
Economic Impact/$
5.3649
Personal tax ratio
30.85
Avoided ratio
66.2
Final figure
2.95
Idaho
Economic Impact/$
5.0661
Personal tax ratio
31.6
Avoided ratio
65.55
Final figure
2.85
Georgia
Economic Impact/$
3.6769
Personal tax ratio
37.6
Avoided ratio
59.24
Final figure
3.16
Hawaii
Economic Impact/$
4.4245
Personal tax ratio
33.56
Avoided ratio
65.17
Final figure
1.27
Delaware
Economic Impact/$
4.6375
Personal tax ratio
33.73
Avoided ratio
63.15
Final figure
3.13
Florida
Economic Impact/$
3.1162
Personal tax ratio
40.11
Avoided ratio
56.21
Final figure
3.68
Connecticut
Economic Impact/$
4.3806
Personal tax ratio
36.16
Avoided ratio
61.55
Final figure
2.29
California
Economic Impact/$
4.7262
Personal tax ratio
35.72
Avoided ratio
61.77
Final figure
2.51
Colorado
Economic Impact/$
3.5905
Personal tax ratio
32.1
Avoided ratio
66.3
Final figure
1.59
Arkansas
Economic Impact/$
3.8247
Personal tax ratio
43.28
Avoided ratio
53.84
Final figure
2.88
Alabama
Economic Impact/$
4.4603
Personal tax ratio
37.03
Avoided ratio
58.79
Final figure
4.18
Alaska
Economic Impact/$
4.8915
Personal tax ratio
27.37
Avoided ratio
71.11
Final figure
1.52
Arizona
Economic Impact/$
3.5478
Personal tax ratio
31.6
Avoided ratio
65.98
Final figure
2.43

Research & Data

While Tri-Share is a relatively new innovation in child care, having first originated in Michigan in 2021, the underlying economic research that supports Tri-Share has been staring at us for some time. 

The Wonderschool team, which has advised multiple states on their implementations, has pulled together a summary of the research supporting an investment in Tri-Share, as well as provided a detailed case study of its work successfully implementing Tri-Share in West Virginia.
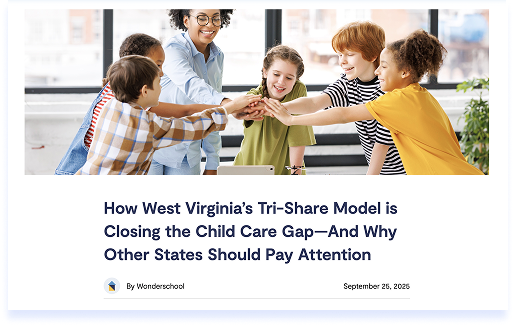
National Tri-Share Research Summary
Review the economic research that supports investing in Tri-Share.
Download
West Virginia Tri-Share Case Study
Read about how Wonderschool's work implementing Tri-Share in West Virginia is closing the child care gap.
Read More

Frequently Asked Questions

Need extra support? Send us a message at
[email protected].
What is the Tri-Share model?
How are Tri-Share programs funded?
How much do employers typically contribute to their employees’ child care tuition?
How much do governments typically contribute as the matching portion of the child care tuition?
Who qualifies for Tri-Share?
How much can families save?
Where is Tri-Share available?
Can Tri-Share work in rural areas?
What technology is required to implement Tri-Share?
How are payments securely collected and submitted?
How quickly can a Tri-Share program launch?
How is Tri-Share different from traditional subsidies?
What are the employer benefits?
Which forms of child care does Tri-Share support?

make child care more affordable for your communities

Contact our team